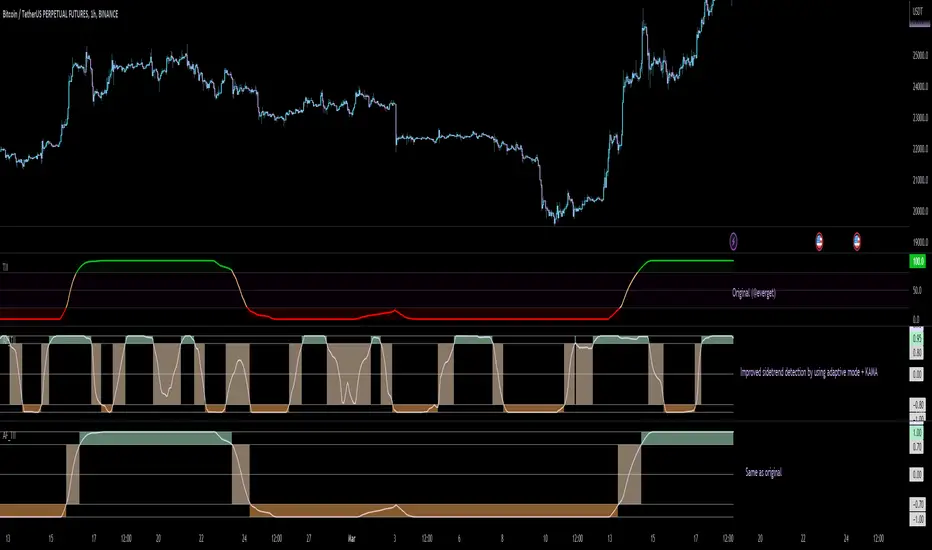
Adaptive Fisherized Trend Intensity Index Introduction
Here, I modified the script "Trend Intensity Index" (TII) of @everyget.
TTI was developed by M.H. Pee, who also published other trend analysis indicators like the Trend Trigger/Continuation Factor
It helps to determine how strong the current trend is.
The stronger the trend, the higher the chance the price may continue moving in the current direction.
Features
Adaptive mode (based on Ehlers dominant cycle determination) => automatically determines the length
Inverse Fisher Transform => gives sharper signals
Customizable MA Types => discover the impact of different ma bases
Hann Window and NET smoothing => state-of-the-art smoothing
Trend Visualization => shows you the up/down/side trend
Usage
This indicator here offers a perfect trend filtering system. It is capable of up/down/side trend detection.
There are a lot of trend indicators which don't respect sidetrends, which makes this indicator pretty useful.
A lot of traders use trend-following trading systems.
A trader will usually make his/her entry in the market during a strong trend and ride it, until the TII provides an indication of a reversal.
For mean-revertive trading systems, you could use TII to just trade in side trend.
A lot of mean-revertive signal emitters like Bollinger Bands or RSI work most of the times better in side trend.
Furthermore, every timeframe could be used, but higher timeframes have more impact because trends are stronger there.
Signals
Green zone (Top) => Etablished bullish trend
"Peachy" Zone (Middle) => Sidetrend/flat market
Red Zone (Bottom) => Etablished bearish trend
Enjoy guys!
(Let me know your opinions!)
--
Credits to:
@blackcat1402
@DasanC
@cheatcountry
@everget
Cari dalam skrip untuk "Up down"
Boyle Trinomial Options Pricing Model [Loxx]Boyle Trinomial Options Pricing Model is an options pricing indicator that builds an N-order trinomial tree to price American and European options. This is different form the Binomial model in that the Binomial assumes prices can only go up and down wheres the Trinomial model assumes prices can go up, down, or sideways (shoutout to the "crab" market enjoyers). This method also allows for dividend adjustment.
The Trinomial Tree via VinegarHill Finance Labs
A two-jump process for the asset price over each discrete time step was developed in the binomial lattice. Boyle expanded this frame of reference and explored the feasibility of option valuation by allowing for an extra jump in the stochastic process. In keeping with Black Scholes, Boyle examined an asset (S) with a lognormal distribution of returns. Over a small time interval, this distribution can be approximated by a three-point jump process in such a way that the expected return on the asset is the riskless rate, and the variance of the discrete distribution is equal to the variance of the corresponding lognormal distribution. The three point jump process was introduced by Phelim Boyle (1986) as a trinomial tree to price options and the effect has been momentous in the finance literature. Perhaps shamrock mythology or the well-known ballad associated with Brendan Behan inspired the Boyle insight to include a third jump in lattice valuation. His trinomial paper has spawned a huge amount of ground breaking research. In the trinomial model, the asset price S is assumed to jump uS or mS or dS after one time period (dt = T/n), where u > m > d. Joshi (2008) point out that the trinomial model is characterized by the following five parameters: (1) the probability of an up move pu, (2) the probability of an down move pd, (3) the multiplier on the stock price for an up move u, (4) the multiplier on the stock price for a middle move m, (5) the multiplier on the stock price for a down move d. A recombining tree is computationally more efficient so we require:
ud = m*m
M = exp (r∆t),
V = exp (σ 2∆t),
dt or ∆t = T/N
where where N is the total number of steps of a trinomial tree. For a tree to be risk-neutral, the mean and variance across each time steps must be asymptotically correct. Boyle (1986) chose the parameters to be:
m = 1, u = exp(λσ√ ∆t), d = 1/u
pu =( md − M(m + d) + (M^2)*V )/ (u − d)(u − m) ,
pd =( um − M(u + m) + (M^2)*V )/ (u − d)(m − d)
Boyle suggested that the choice of value for λ should exceed 1 and the best results were obtained when λ is approximately 1.20. One approach to constructing trinomial trees is to develop two steps of a binomial in combination as a single step of a trinomial tree. This can be engineered with many binomials CRR(1979), JR(1979) and Tian (1993) where the volatility is constant.
Further reading:
A Lattice Framework for Option Pricing with Two State
Trinomial tree via wikipedia
Inputs
Spot price: select from 33 different types of price inputs
Calculation Steps: how many iterations to be used in the Trinomial model. In practice, this number would be anywhere from 5000 to 15000, for our purposes here, this is limited to 220.
Strike Price: the strike price of the option you're wishing to model
Market Price: this is the market price of the option; choose, last, bid, or ask to see different results
Historical Volatility Period: the input period for historical volatility ; historical volatility isn't used in the Trinomial model, this is to serve as a comparison, even though historical volatility is from price movement of the underlying asset where as implied volatility is the volatility of the option
Historical Volatility Type: choose from various types of implied volatility , search my indicators for details on each of these
Option Base Currency: this is to calculate the risk-free rate, this is used if you wish to automatically calculate the risk-free rate instead of using the manual input. this uses the 10 year bold yield of the corresponding country
% Manual Risk-free Rate: here you can manually enter the risk-free rate
Use manual input for Risk-free Rate? : choose manual or automatic for risk-free rate
% Manual Yearly Dividend Yield: here you can manually enter the yearly dividend yield
Adjust for Dividends?: choose if you even want to use use dividends
Automatically Calculate Yearly Dividend Yield? choose if you want to use automatic vs manual dividend yield calculation
Time Now Type: choose how you want to calculate time right now, see the tool tip
Days in Year: choose how many days in the year, 365 for all days, 252 for trading days, etc
Hours Per Day: how many hours per day? 24, 8 working hours, or 6.5 trading hours
Expiry date settings: here you can specify the exact time the option expires
Included
Option pricing panel
Loxx's Expanded Source Types
Related indicators
Implied Volatility Estimator using Black Scholes
Cox-Ross-Rubinstein Binomial Tree Options Pricing Model

Tick StatisticsTick Statistics:
I have seen many questions/queries related to tick data in TV telegram channels. This script will help pine scripts to understand how ticks work, how to capture and process tick data.
This is an educational indicator script for pine scripters.
The indicator shall work only on real time candles. Tick data capture is initiated as soon as indicator is loaded on the chart. You might not get correct statistics on 1st candle in case indicator is loaded when real time candle is in progress, in such case you can monitor the statistics generated for subsequent candles.
Generated statistics is shown on the chart by placing 2 diamond shapes above and below the candle.
Diamond shape below the candle will have candles ‘tick data’ listed in a table. This can be view by placing mouse pointer on the diamond shape. Refer to point 1 below for more details.
Diamond shape above the candle will have statistics as mentioned in point no 2 onwards. To view the statistics place the mouse point on the diamond shape. The shape will appear in green color when both tick price and tick volume are both moving in the same direction. The diamond shape in red color means tick price and tick volume are moving in opposite direction.
The script captures tick by tick data and generate statistics below:
1. List of tick data with details below: (this is stored in the diamond shape placed below the candle)
a. Tick no
b. Tick type – Up tick (Up), Down tick (Dn), No change (--)
c. Tick price
d. Volume
e. Price difference (as compared to previous tick price)
f. Volume difference (as compared to previous tick volume)
2. Tick statistics
a. Total ticks
b. Number of up ticks
c. Number of down ticks
d. Number of No change ticks
3. Volume Statistics
a. Total volume
b. Up tick volume
c. Down tick volume
d. Volume associated with ticks where there is no change
e. Candle volume (just for reconciliation purpose)
4. Max-min statistics
a. Max volume = <> at price = <> at tick no = <>
b. Min volume = <> at price = <> at tick no = <>
c. Max price = <> at volume = <> at tick no = <>
d. Min price = <> at volume = <> at tick no = <>
5. Candle summary
a. Price << Up >> (if price is up as compared to 1st tick <> otherwise
b. Volume <> (if up tick volume is more than down tick volume <> otherwise

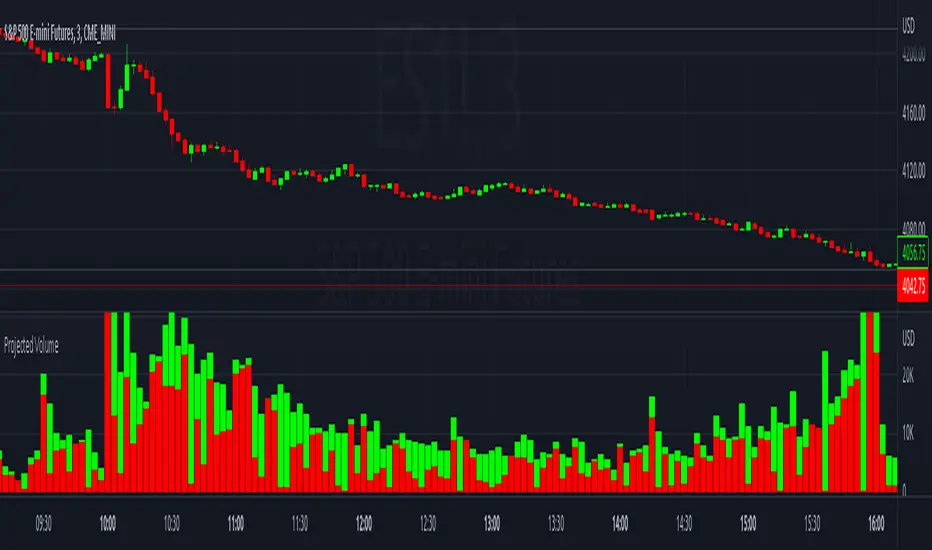
Projected VolumeThe indicator projects what each candle's final volume will be based on the amount of volume per second so far.
Options:
Disable Projected Volume: Show current volume Instead of projecting the final volume
Show Volume Pressure: Adds a visual representation of the volume from the candle wick that is moving against the current direction.
When Volume Pressure is enabled:
On a green candle:
The red part represents the upper wick, the volume as the price comes back down from its high
The green part represents the rest of the candle, the volume as the price goes up from its low to the close
On a red candle:
The green part represents the lower wick, the volume as the price comes back up from its low
The red part represents the rest of the candle, the volume as the price goes down from its high to the close
If Volume Bars Overlap with Chart:
By default, the volume bars are overlayed in the same chart pane as the candles, with the scale on the left side. If they overlap and interfere with the candles, you can fix with these options:
To move indicator to a new pane below the chart:
Select the indicator and click on the 3 dots "..."
Select Move To > New Pane Below
Select Pin to Scale > Pin to Scale A (this will move the scale to the right side)
To adjust volume bar scale:
Go to the scale on the left/right side, hold down the mouse and drag it up/down to make the volume bars longer/shorter
To move the entire volume block up/down on the chart, click on the volume bars and hold down the mouse, then drag it up/down
To update to the latest version, just close the indicator and add it again.
Magnifying Glass (LTF Candles) by SiddWolf█ OVERVIEW
This indicator displays The Lower TimeFrame Candles in current chart, Like Zooming in on the Candle to see it's Lower TimeFrame Structure. It plots intrabar OHLC data inside a Label along with the volume structure of LTF candle in an eloquent format.
█ QUICK GUIDE
Just apply it to the chart, Hover the mouse on the Label and ta-da you have a Lower Timeframe OHLC candles on your screen. Move the indicator to the top and shrink it all the way up, because all the useful data is inside the label.
Inside the label: The OHLC ltf candles are pretty straightforward. Volume strength of ltf candles is shown at bottom and Volume Profile on the left. Read the Details below for more information.
In the settings, you will find the option to change the UI and can play around with Lower TimeFrame Settings.
█ DETAILS
First of all, I would like to thank the @TradingView team for providing the function to get access to the lower timeframe data. It is because of them that this magical indicator came into existence.
Magnifying Glass indicator displays a Candle's Lower TimeFrame data in Higher timeframe chart. It displays the LTF candles inside a label. It also shows the Volume structure of the lower timeframe candles. Range percentage shown at the bottom is the percentage change between high and low of the current timeframe candle. LTF candle's timeframe is also shown at the bottom on the label.
This indicator is gonna be most useful to the price action traders, which is like every profitable trader.
How this indicator works:
I didn't find any better way to display ltf candles other than labels. Labels are not build for such a complex behaviour, it's a workaround to display this important information.
It gets the lower timeframe information of the candle and uses emojis to display information. The area that is shown, is the range of the current timeframe candle. Range is a difference between high and low of the candle. Range percentage is also shown at the bottom in the label.
I've divided the range area into 20 parts because there are limitation to display data in the labels. Then the code checks out, in what area does the ltf candle body or wick lies, then displays the information using emojis.
The code uses matrix elements for each block and relies heavily on string manipulation. But what I've found most difficult, is managing to fit everything correctly and beautifully so that the view doesn't break.
Volume Structure:
Strength of the Lower TimeFrame Candles is shown at the bottom inside the label. The Higher Volume is shown with the dark shade color and Lower Volume is shown with the light shade. The volume of candles are also ranked, with 1 being the highest volume, so you can see which candle have the maximum to minimum volume. This is pretty important to make a price action analysis of the lower timeframe candles.
Inside the label on the left side you will see the volume profile. As the volume on the bottom shows the strength of each ltf candles, Volume profile on the left shows strength in a particular zone. The Darker the color, the higher the volume in the zone. The Highest volume on the left represents Point of Control (Volume Profile POC) of the candle.
Lower TimeFrame Settings:
There is a limitation for the lowest timeframe you can show for a chart, because there is only so much data you can fit inside a label. A label can show upto 20 blocks of emojis (candle blocks) per row. Magnifying Glass utilizes this behaviour of labels. 16 blocks are used to display ltf candles, 1 for volume profile and two for Open and Close Highlighter.
So for any chart timeframe, ltf candles can be 16th part of htf candle. So 4 hours chart can show as low as 15 minutes of ltf data. I didn't provide the open settings for changing the lower timeframe, as it would give errors in a lot of ways. You can change the timeframe for each chart time from the settings provided.
Limitations:
Like I mentioned earlier, this indicator is a workaround to display ltf candles inside a label. This indicator does not work well on smaller screens. So if you are not able to see the label, zoom out on your browser a bit. Move the indicator to either top or bottom of all indicators and shrink it's space because all details are inside the label.
█ How I use MAGNIFYING GLASS:
This indicator provides you an edge, on top of your existing trading strategy. How you use Magnifying Glass is entirely dependent on your strategy.
I use this indicator to get a broad picture, before getting into a trade. For example I see a Doji or Engulfing or any other famous candlestick pattern on important levels, I hover the mouse on Magnifying Glass, to look for the price action the ltf candles have been through, to make that pattern. I also use it with my "Wick Pressure" indicator, to check price action at wick zones. Whenever I see price touching important supply and demand zones, I check last few candles to read chart like a beautiful price action story.
Also volume is pretty important too. This is what makes Magnifying Glass even better than actual lower timeframe candles. The increasing volume along with up/down trend price shows upward/downward momentum. The sudden burst (peak) in the volume suggests volume climax.
Volume profile on the left can be interpreted as the strength/weakness zones inside a candle. The low volume in a price zone suggests weakness and High volume suggests strength. The Highest volume on the left act as POC for that candle.
Before making any trade, I read the structure of last three or four candles to get the complete price action picture.
█ Conclusion
Magnifying Glass is a well crafted indicator that can be used to track lower timeframe price action. This indicator gives you an edge with the Multi Timeframe Analysis, which I believe is the most important aspect of profitable trading.
~ @SiddWolf

CVD - Cumulative Volume Delta Candles█ OVERVIEW
This indicator displays cumulative volume delta in candle form. It uses intrabar information to obtain more precise volume delta information than methods using only the chart's timeframe.
█ CONCEPTS
Bar polarity
By bar polarity , we mean the direction of a bar, which is determined by looking at the bar's close vs its open .
Intrabars
Intrabars are chart bars at a lower timeframe than the chart's. Each 1H chart bar of a 24x7 market will, for example, usually contain 60 bars at the lower timeframe of 1min, provided there was market activity during each minute of the hour. Mining information from intrabars can be useful in that it offers traders visibility on the activity inside a chart bar.
Lower timeframes (LTFs)
A lower timeframe is a timeframe that is smaller than the chart's timeframe. This script uses a LTF to access intrabars. The lower the LTF, the more intrabars are analyzed, but the less chart bars can display CVD information because there is a limit to the total number of intrabars that can be analyzed.
Volume delta
The volume delta concept divides a bar's volume in "up" and "down" volumes. The delta is calculated by subtracting down volume from up volume. Many calculation techniques exist to isolate up and down volume within a bar. The simplest techniques use the polarity of interbar price changes to assign their volume to up or down slots, e.g., On Balance Volume or the Klinger Oscillator . Others such as Chaikin Money Flow use assumptions based on a bar's OHLC values. The most precise calculation method uses tick data and assigns the volume of each tick to the up or down slot depending on whether the transaction occurs at the bid or ask price. While this technique is ideal, it requires huge amounts of data on historical bars, which usually limits the historical depth of charts and the number of symbols for which tick data is available.
This indicator uses intrabar analysis to achieve a compromise between the simplest and most precise methods of calculating volume delta. In the context where historical tick data is not yet available on TradingView, intrabar analysis is the most precise technique to calculate volume delta on historical bars on our charts. Our Volume Profile indicators use it. Other volume delta indicators in our Community Scripts such as the Realtime 5D Profile use realtime chart updates to achieve more precise volume delta calculations, but that method cannot be used on historical bars, so those indicators only work in real time.
This is the logic we use to assign intrabar volume to up or down slots:
• If the intrabar's open and close values are different, their relative position is used.
• If the intrabar's open and close values are the same, the difference between the intrabar's close and the previous intrabar's close is used.
• As a last resort, when there is no movement during an intrabar and it closes at the same price as the previous intrabar, the last known polarity is used.
Once all intrabars making up a chart bar have been analyzed and the up or down property of each intrabar's volume determined, the up volumes are added and the down volumes subtracted. The resulting value is volume delta for that chart bar.
█ FEATURES
CVD Candles
Cumulative Volume Delta Candles present volume delta information as it evolves during a period of time.
This is how each candle's levels are calculated:
• open : Each candle's' open level is the cumulative volume delta for the current period at the start of the bar.
This value becomes zero on the first candle following a CVD reset.
The candles after the first one always open where the previous candle closed.
The candle's high, low and close levels are then calculated by adding or subtracting a volume value to the open.
• high : The highest volume delta value found in intrabars. If it is not higher than the volume delta for the bar, then that candle will have no upper wick.
• low : The lowest volume delta value found in intrabars. If it is not lower than the volume delta for the bar, then that candle will have no lower wick.
• close : The aggregated volume delta for all intrabars. If volume delta is positive for the chart bar, then the candle's close will be higher than its open, and vice versa.
The candles are plotted in one of two configurable colors, depending on the polarity of volume delta for the bar.
CVD resets
The "cumulative" part of the indicator's name stems from the fact that calculations accumulate during a period of time. This allows you to analyze the progression of volume delta across manageable chunks, which is often more useful than looking at volume delta cumulated from the beginning of a chart's history.
You can configure the reset period using the "CVD Resets" input, which offers the following selections:
• None : Calculations do not reset.
• On a fixed higher timeframe : Calculations reset on the higher timeframe you select in the "Fixed higher timeframe" field.
• At a fixed time that you specify.
• At the beginning of the regular session .
• On a stepped higher timeframe : Calculations reset on a higher timeframe automatically stepped using the chart's timeframe and following these rules:
Chart TF HTF
< 1min 1H
< 3H 1D
<= 12H 1W
< 1W 1M
>= 1W 1Y
The indicator's background shows where resets occur.
Intrabar precision
The precision of calculations increases with the number of intrabars analyzed for each chart bar. It is controlled through the script's "Intrabar precision" input, which offers the following selections:
• Least precise, covering many chart bars
• Less precise, covering some chart bars
• More precise, covering less chart bars
• Most precise, 1min intrabars
As there is a limit to the number of intrabars that can be analyzed by a script, a tradeoff occurs between the number of intrabars analyzed per chart bar and the chart bars for which calculations are possible.
Total volume candles
You can choose to display candles showing the total intrabar volume for the chart bar. This provides you with more context to evaluate a bar's volume delta by showing it relative to the sum of intrabar volume. Note that because of the reasons explained in the "NOTES" section further down, the total volume is the sum of all intrabar volume rather than the volume of the bar at the chart's timeframe.
Total volume candles can be configured with their own up and down colors. You can also control the opacity of their bodies to make them more or less prominent. This publication's chart shows the indicator with total volume candles. They are turned off by default, so you will need to choose to display them in the script's inputs for them to plot.
Divergences
Divergences occur when the polarity of volume delta does not match that of the chart bar. You can identify divergences by coloring the CVD candles differently for them, or by coloring the indicator's background.
Information box
An information box in the lower-left corner of the indicator displays the HTF used for resets, the LTF used for intrabars, and the average quantity of intrabars per chart bar. You can hide the box using the script's inputs.
█ INTERPRETATION
The first thing to look at when analyzing CVD candles is the side of the zero line they are on, as this tells you if CVD is generally bullish or bearish. Next, one should consider the relative position of successive candles, just as you would with a price chart. Are successive candles trending up, down, or stagnating? Keep in mind that whatever trend you identify must be considered in the context of where it appears with regards to the zero line; an uptrend in a negative CVD (below the zero line) may not be as powerful as one taking place in positive CVD values, but it may also predate a movement into positive CVD territory. The same goes with stagnation; a trader in a long position will find stagnation in positive CVD territory less worrisome than stagnation under the zero line.
After consideration of the bigger picture, one can drill down into the details. Exactly what you are looking for in markets will, of course, depend on your trading methodology, but you may find it useful to:
• Evaluate volume delta for the bar in relation to price movement for that bar.
• Evaluate the proportion that volume delta represents of total volume.
• Notice divergences and if the chart's candle shape confirms a hesitation point, as a Doji would.
• Evaluate if the progress of CVD candles correlates with that of chart bars.
• Analyze the wicks. As with price candles, long wicks tend to indicate weakness.
Always keep in mind that unless you have chosen not to reset it, your CVD resets for each period, whether it is fixed or automatically stepped. Consequently, any trend from the preceding period must re-establish itself in the next.
█ NOTES
Know your volume
Traders using volume information should understand the volume data they are using: where it originates and what transactions it includes, as this can vary with instruments, sectors, exchanges, timeframes, and between historical and realtime bars. The information used to build a chart's bars and display volume comes from data providers (exchanges, brokers, etc.) who often maintain distinct feeds for intraday and end-of-day (EOD) timeframes. How volume data is assembled for the two feeds depends on how instruments are traded in that sector and/or the volume reporting policy for each feed. Instruments from crypto and forex markets, for example, will often display similar volume on both feeds. Stocks will often display variations because block trades or other types of trades may not be included in their intraday volume data. Futures will also typically display variations.
Note that as intraday vs EOD variations exist for historical bars on some instruments, differences may also exist between the realtime feeds used on intraday vs 1D or greater timeframes for those same assets. Realtime reporting rules will often be different from historical feed reporting rules, so variations between realtime feeds will often be different from the variations between historical feeds for the same instrument. The Volume X-ray indicator can help you analyze differences between intraday and EOD volumes for the instruments you trade.
If every unit of volume is both bought by a buyer and sold by a seller, how can volume delta make sense?
Traders who do not understand the mechanics of matching engines (the exchange software that matches orders from buyers and sellers) sometimes argue that the concept of volume delta is flawed, as every unit of volume is both bought and sold. While they are rigorously correct in stating that every unit of volume is both bought and sold, they overlook the fact that information can be mined by analyzing variations in the price of successive ticks, or in our case, intrabars.
Our calculations model the situation where, in fully automated order handling, market orders are generally matched to limit orders sitting in the order book. Buy market orders are matched to quotes at the ask level and sell market orders are matched to quotes at the bid level. As explained earlier, we use the same logic when comparing intrabar prices. While using intrabar analysis does not produce results as precise as when individual transactions — or ticks — are analyzed, results are much more precise than those of methods using only chart prices.
Not only does the concept underlying volume delta make sense, it provides a window on an oft-overlooked variable which, with price and time, is the only basic information representing market activity. Furthermore, because the calculation of volume delta also uses price and time variations, one could conceivably surmise that it can provide a more complete model than ones using price and time only. Whether or not volume delta can be useful in your trading practice, as usual, is for you to decide, as each trader's methodology is different.
For Pine Script™ coders
As our latest Polarity Divergences publication, this script uses the recently released request.security_lower_tf() Pine Script™ function discussed in this blog post . It works differently from the usual request.security() in that it can only be used at LTFs, and it returns an array containing one value per intrabar. This makes it much easier for programmers to access intrabar information.
Look first. Then leap.

Realtime FootprintThe purpose of this script is to gain a better understanding of the order flow by the footprint. To that end, i have added unusual features in addition to the standard features.
I use "Real Time 5D Profile by LucF" main engine to create basic footprint(profile type) and added some popular features and my favorites.
This script can only be used in realtime, because tradingview doesn't provide historical Bid/Ask date.
Bid/Ask date used this script are up/down ticks.
This script can only be used by time based chart (1m, 5m , 60m and daily etc)
This script use many labels and these are limited max 500, so you can't display many bars.
If you want to display foot print bars longer, turn off the unused sub-display function.
Default setting is footprint is 25 labels, IB count is 1, COT high and Ratio high is 1, COT low and Ratio low is 1 and Delta Box Ratio Volume is 1 , total 29.
plus UA , IB stripes , ladder fading mark use several labels.
///////// General Setting ///////////
Resets on Volume / Range bar
: If you want to use simple time based Resets on, please set Total Volume is 0.
Your timeframe is always the first condition. So if you set Total Volume is 1000, both conditions(Volume >= 1000 and your timeframe start next bar) must be met. (that is, new footprint bar doesn't start at when total volume = exactly 1000).
Ticks per row and Maximum row of Bar
: 1 is minimum size(tick). "Maximum row of Bar" decide the number of rows used in one footprint. 1 row is created from 1 label, so you need to reduce this number to display many footprints (Max label is 500).
Volume Filter and For Calculation and Display
: "Volume Filter" decide minimum size of using volume for this script.
"For Calculation and Display" is used to convert volume to an integer.
This script only use integer to make profile look better (I contained Bid number and Ask number in one row( one label) to saving labels. This require to make no difference in width by the number of digits and this script corresponds integers from 0 to 3 digits).
ex) Symbol average volume size is from 0.0001 to 0.001. You decide only use Volume >= 0.0005 by "Volume Filter".
Next, you convert volume to integer, by setting "For Calculation and Display" is 1000 (0.0005 * 1000 = 5).
If 0.00052 → 5.2 → 5, 0.00058 → 5.8 → 6 (Decimal numbers are rounded off)
This integer is used to all calculation in this script.
//////// Main Display ///////
Footprint, Total, Row Delta, Diagonal Delta and Profile
: "Footprint" display Ask and Bid per row. "Total" display Ask + Bid per row.
"Row Delta" display Ask - Bid per row. "Diagonal Delta" display Ask(row N) - Bid(row N -1) per row.
Profile display Total Volume(Ask + Bid) per row by using Block. Profile Block coloring are decided by Row Delta value(default: positive Row Delta (Ask > Bid) is greenish colors and negative Row Delta (Ask < Bid) is reddish colors.)
Volume per Profile Block, Row Imbalance Ratio and Delta Bull/Bear/Neutral Colors
: "Volume per Profile Block" decide one block contain how many total volume.
ex) When you set 20, Total volume 70 display 3 block.
The maximum number of blocks that can be used per low is 20.
So if you set 20, Total volume 400 is 20 blocks. total volume 800 is 20 blocks too.
"Row Imbalance Ratio" decide block coloring. The row imbalance is that the difference between Ask and Bid (row delta) is large.
default is x3, x2 and x1. The larger the difference, the brighter the color.
ex) Ask 30 Bid 10 is light green. Ask 20 Bid 10 is green. Ask 11 Bid 10 is dark green.
Ask 0 Bid 1 is light red. Ask 1 Bid 2 is red. ask 30 Bid 59 is dark green.
Ask 10 Bid 10 is neutral color(gray)
profile coloring is reflected same row's other elements(Ask, Bid, Total and Delta) too.
It's because one label can only use one text color.
/////// Sub Display ///////
Delta, total and Commitment of Traders
: "Delta" is total Ask - total Bid in one footprint bar. Total is total Ask + total Bid in one footprint bar.
"Commitment of traders" is variation of "Delta". COT High is reset to 0 when current highest is touched. COT Low is opposite.
Basic concept of Delta is to compare price with Delta. Ordinary, when price move up, delta is positive. Price move down is negative delta.
This is because market orders move price and market orders are counted by Delta (although this description is not exactly correct).
But, sometimes prices do not move even though many market orders are putting pressure on price , or conversely, price move strongly without many market orders.
This is key point. Big player absorb market orders by iceberg order(Subdivide large orders and pretend to be small limit orders.
Small limit orders look weak in the order book, but they are added each time you fill, so they are more powerful than they look.), so price don't move.
On the other hand, when the price is moving easily, smart players may be aiming to attract and counterattack to a better price for them.
It's more of a sport than science, and there's always no right response. Pay attention to the relationship between price, volume and delta.
ex) If COT Low is large negative value, it means many sell market orders is coming, but iceberg order is absorbing their attack at limit order.
you should not do buy entry, only this clue. but this is one of the hints.
"Delta, Box Ratio and Total texts is contained same label and its color are "Delta" coloring. Positive Delta is Delta Bull color(green),Negative Delta is Delta Bear Color
and Delta = 0 is Neutral Color(gray). When Delta direction and price direction are opposite is Delta Divergence Color(yellow).
I didn't add the cumulative volume delta because I prefer to display the CVD line on the price chart rather than the number.
Box Ratio , Box Ratio Divisor and Heavy Box Ratio Ratio
: This is not ordinary footprint features, but I like this concept so I added.
Box Ratio by Richard W. Arms is simple but useful tool. calculation is "total volume (one bar) divided by Bar range (highest - lowest)."
When Bull and bear are fighting fiercely this number become large, and then important price move happen.
I made average BR from something like 5 SMA and if current BR exceeds average BR x (Heavy Box Ratio Ratio), BR box mark will be filled.
Box Ratio Divisor is used to good looking display(BR multiplied by Box Ratio Divisor is rounded off and displayed as an integer)
Diagonal Imbalance Count , D IB Mark and D IB Stripes
: Diagonal Imbalance is defined by "Diagonal Imbalance Ratio".
ex) You set 2. When Ask(row N) 30 Bid(row N -1)10, it's 30 > 10*2, so positive Diagonal Imbalance.
When Ask(row N) 4 Bid(row N -1)9, it's 4*2 < 9, so negative Diagonal Imbalance.
This calculation does not use equals to avoid Ask(row N) 0 Bid(row N -1)0 became Diagonal Imbalance.
Ask(row N) 0 Bid(row N -1)0, it's 0 = 0*2, not Diagonal Imbalance. Ask(row N) 10 Bid(row N -1)5, it's 10 = 5*2, not Diagonal Imbalance.
"D IB Mark" emphasize Ask or Bid number which is dominant side(Winner of Diagonal Imbalance calculation), by under line.
"Diagonal Imbalance Count" compare Ask side D IB Mark to Bid side D IB Mark in one footprint.
Coloring depend on which is more aggressive side (it has many IB Mark) and When Aggressive direction and price direction are opposite is Delta Divergence Color(yellow).
"D IB Stripes" is a function that further emphasizes with an arrow Mark, when a DIB mark is added on the same side for three consecutive row. Three consecutive arrow is added at third row.
Unfinished Auction, Ratio Bounds and Ladder fading Mark
: "Unfinished Auction" emphasize highest or lowest row which has both Ask and Bid, by Delta Divergence Color(yellow) XXXXXX mark.
Unfinished Auction sometimes has magnet effect, price may touch and breakout at UA side in the future.
This concept is famous as profit taking target than entry decision.
But, I'm interested in the case that Big player make fake breakout at UA side and trapped retail traders, and then do reversal with retail traders stop-loss hunt.
Anyway, it's not stand alone signal.
"Ratio Bounds" gauge decrease of pressure at extreme price. Ratio Bounds High is number which second highest ask is divided by highest ask.
Ratio Bounds Low is number which second lowest bid is divided by lowest bid. The larger the number, the less momentum the price has.
ex)first footprint bar has Ratio Bounds Low 2, second footprint bar has RBL 4, third footprint bar has RBL 20.
This indicates that the bear's power is gradually diminishing.
"Ladder fading mark" emphasizes the decrease of the value in 3 consecutive row at extreme price. I added two type Marks.
Ask/Bid type(triangle Mark) is Ask/Bid values are decreasing of three consecutive row at extreme price.
Row Imbalance type(Diamond Mark) are row Imbalance values are decreasing of three consecutive row at extreme price.
ex)Third lowest Bid 40, second lowest Bid 10 and lowest Bid 5 have triangle up Mark. That is bear's power is gradually diminishing.
(This Mark only check Bid value at lowest price and Ask value at highest price).
Third highest row delta + 60, second highest row delta + 5, highest delta - 20 have diamond Mark. That is Bull's power is gradually diminishing.
Sub display use Delta colors at bottom of Sub display section.
////// Candle & POC /////////
candle and POC
: Ordinary, "POC" Point of Control is row of largest total volume, but this script'POC is volume weighted average.
This is because the regular POC was visually displayed by the profile ,and I was influenced LucF's ideas.
POC coloring is decided in relation to the previous POC. When current POC is higher than previous POC, color is UP Bar Color(green).
In the opposite case, Down Bar color is used.
POC Divergence Color is used when Current POC is up but current bar close is lower than open (Down price Bar),or in the opposite case.
POC coloring has option also highlight background by Delta Divergence Color(yellow). but bg color is displayed at your time frame current price bar not current footprint bar.
The basic explanation is over.
I add some image to promote understanding basic ideas.

Close strength lineThe close strength line shows how much the strength in the current up/down trend actually present.
We calculate it by difference between High-Low and the way it moves with respect to Close moving averages.
You can change intervals from settings.
Use this in combination with any other moving average indicator e.g. EMA 13
when Close line is below other indicators/priceline, it is Uptrend and close line acts as support.
when Close line is above other indicators/priceline, it is Downtrend and close line acts as resistance.
You can also use Close line as potential Targets for Buy or Short trades depending on it's direction with respect to price line last Close.

4-Way EMA Trend4 separate EMAs that are used to determine trend, colored appropriately to reflect the trend to make it easy to tell what the trend is. All 4 EMAs are not needed, you can turn each one on and off individually and the indicator will adjust itself accordingly. Having a single EMA will use the closing price to determine the trend. There are 2 different types of trend detection; EMA Flip and EMA Confluence. EMA Flip is dependent on all active EMAs rising or falling in the correct hierarchical order. The EMA Confluence option is if all EMAs are moving in the same direction. I've found that this second option, EMA Confluence, is more accurate in getting in early before strong movements because the EMAs will more often move in the same direction before they "flip".

Linear Regression Channel Breakout StrategyThis strategy is based on LonesomeTheBlue's Linear Regression Channel Indicator. First of all, I would like to thank LonesomeTheBlue. Breaking the Linear Regression Channel to close the candle triggers a Long or Short signal. If the slope of the Linear Regression Channel is positive, it is Short when it breaks out the lower line, and when the slope is negative, it is Long when it breaks out the upper line. The default is optimized for 8-hour candles, and for other hour candles, find the optimal value yourself. Below is a description of LonesomeTheBlue's Linear Regression Channel.
이 전략은 LonesomeTheBlue의 Linear Regression Channel Indicator를 기반으로 만들어졌습니다. 우선 LonesomeTheBlue님께 감사의 말씀을 드립니다. Linear Regression Channel을 돌파하여 봉 마감하면 Long 또는 Short 신호를 트리거합니다. Linear Regression Channel의 기울기가 양인 경우 하단 라인을 돌파하면 Short이고 그 기울기가 음인 경우 상단 라인을 돌파하면 Long입니다. 기본값은 8시간봉에 최적화 되어 있으며, 다른 시간봉은 직접 최적값을 찾아보십시오. 아래는 LonesomeTheBlue의 Linear Regression Channel에 대한 설명을 퍼왔습니다.
________________________________________________
There are several nice Linear Regression Channel scripts in the Public Library. and I tried to make one with some extra features too. This one can check if the Price breaks the channel and it shows where is was broken. Also it checks the momentum of the channel and shows it's increasing/decreasing/equal in a label, shape of the label also changes. The line colors change according to direction.
using the options, you can;
- Set the Source (Close, HL2 etc)
- Set the Channel length
- Set Deviation
- Change Up/Down Line colors
- Show/hide broken channels
- Change line width
meaning of arrows:
⇑ : Uptrend and moment incresing
⇗ : Uptrend and moment decreasing
⇓ : Downtrend and moment incresing
⇘ : Downtrend and moment decreasing
⇒ : No trend

Realtime 5D Profile [LucF]█ OVERVIEW
This indicator displays a realtime profile that can be configured to visualize five dimensions: volume, price, time, activity and age. For each price level in a bar or timeframe, you can display total or delta volume or ticks. The tick count measures activity on a level. The thickness of each level's line indicates its age, which helps you identify the most recent levels.
█ WARNING
The indicator only works in real time. Contrary to TradingView's line of volume profile indicators , it does not show anything on historical bars or closed markets, and it cannot display volume information if none exists for the data feed the chart is using. A realtime indicator such as this one only displays information accumulated while it is running on a chart. The information it calculates cannot be saved on charts, nor can it be recalculated from historical bars. If you refresh the chart, or the script must re-execute for some reason, as when you change inputs, the accumulated information will be lost.
Because "Realtime 5D Profile" requires time to accumulate information on the chart, it will be most useful to traders working on small timeframes who trade only one instrument and do not frequently change their chart's symbol or timeframe. Traders working on higher timeframes or constantly changing charts will be better served by TradingView's volume profiles. Before using this indicator, please see the "Limitations" section further down for other important information.
█ HOW TO USE IT
Load the indicator on an active chart (see here if you don't know how).
The default configuration displays:
• A double-sided volume profile showing at what price levels activity has occurred.
• The left side shows "down" volume, the right side shows "up" volume.
• The value corresponding to each level is displayed.
• The width of lines reflects their relative value.
• The thickness of lines reflects their age. Four thicknesses are used, with the thicker lines being the most recent.
• The total value of down/up values for the profile appears at the top.
To understand how to use profiles in your trading, please research the subject. Searches on "volume profile" or "market profile" will yield many useful results. I provide you with tools — I do not teach trading. To understand more about this indicator, read on. If you choose not to do so, please don't ask me to answer questions that are already answered here, nor to make videos; I don't.
█ CONCEPTS
Delta calculations
Volume is slotted in up or down slots depending on whether the price of each new chart update is higher or lower than the previous update's price. When price does not move between chart updates, the last known direction is used. In a perfect world, Pine scripts would have access to bid and ask levels, as this would allow us to know for sure if market orders are being filled on upticks (at the ask) or downticks (at the bid). Comparing the price of successive chart updates provides the most precise way to calculate volume delta on TradingView, but it is still a compromise. Order books are in constant movement; in some cases, order cancellations can cause sudden movements of both the bid and ask levels such that the next chart update can occur on an uptick at a lower price than the previous one (or vice versa). While this update's volume should be slotted in the up slot because a buy market order was filled, it will erroneously be slotted in the down slot because the price of the chart's update is lower than that of the previous one. Luckily, these conditions are relatively rare, so they should not adversely affect calculations.
Levels
A profile is a tool that displays information organized by price levels. You can select the maximum quantity of levels this indicator displays by using the script's "Levels" input. If the profile's height is small enough for level increments to be less than the symbol's tick size, a smaller quantity of levels is used until the profile's height grows sufficiently to allow your specified quantity of levels to be displayed. The exact position of levels is not tethered to the symbol's tick increments. Activity for one level is that which happens on either side of the level, halfway between its higher or lower levels. The lowest/highest levels in the profile thus appear higher/lower than the profile's low/high limits, which are determined by the lowest/highest points reached by price during the profile's life.
Level Values and Length
The profile's vertical structure is dynamic. As the profile's height changes with the price range, it is rebalanced and the price points of its levels may be recalculated. When this happens, past updates will be redistributed among the new profile's levels, and the level values may thus change. The new levels where updates are slotted will of course always be near past ones, but keep this fluidity in mind when watching level values evolve.
The profile's horizontal structure is also dynamic. The maximum length of level lines is controlled by the "Maximum line length" input value. This maximum length is always used for the largest level value in the profile, and the length of other levels is determined by their value relative to that maximum.
Updates vs Ticks
Strictly speaking, a tick is the record of a transaction between two parties. On TradingView, these are detected on seconds charts. On other charts, ticks are aggregated to form a chart update . I use the broader "update" term when it names both events. Note that, confusingly, tick is also used to name an instrument's minimal price increment.
Volume Quality
If you use volume, it's important to understand its nature and quality, as it varies with sectors and instruments. My Volume X-ray indicator is one way you can appraise the quality of an instrument's intraday volume.
█ FEATURES
Double-Sided Profiles
When you choose one of the first two configuration selections in the "Configuration" field's dropdown menu, you are asking the indicator to display a double-sided profile, i.e., where the down values appear on the left and the up ones on the right. In this mode, the formatting options in the top section of inputs apply to both sides of the profile.
Single-Sided Profiles
The six other selections down the "Configuration" field's dropdown menu select single-sided profiles, where one side aggregates the up/down values for either volume or ticks. In this mode, the formatting options in the top section of inputs apply to the left profile. The ones in the following "Right format" section apply to the right profile.
Calculation Mode
The "Calculation" input field allows the selection of one of two modes which applies to single-sided profiles only. Values can represent the simple total of volume or ticks at each level, or their delta. The mode has no effect when a double-sided profile is used because then, the total is represented by the sum of the left and right sides. Note that when totals are selected, all levels appear in the up color.
Age
The age of each level is always displayed as one of four line thicknesses. Thicker lines are used for the youngest levels. The age of levels is determined by averaging the times of the updates composing that level. When viewing double-sided profiles, the age of each side is calculated independently, which entails you can have a down level on the left side of the profile appear thinner than its corresponding up side level line on the right side because the updates composing the up side are more recent. When calculating the age of single-sided profiles, the age of the up/down values aggregated to calculate the side are averaged. Since they may be different, the averaged level ages will not be as responsive as when using a double-sided profile configuration, where the age of levels on each side is calculated independently and follows price action more closely. Moreover, when displaying two single-sided profiles (volume on one side and ticks on the other), the age of both sides will match because they are calculated from the same realtime updates.
Profile Resets
The profile can reset on timeframes or trend changes. The usual timeframe selections are available, including the chart's, in which case the profile will reset on each new chart bar. One of two trend detection logics can be used: Supertrend or the one used by LazyBear in his Weis Wave indicator . Settings for the trend logics are in the bottommost section of the inputs, where you can also control the display of trend changes and states. Note that the "Timeframe" field's setting also applies to the trend detection mechanism. Whatever the timeframe used for trend detection, its logic will not repaint.
Format
Formatting a profile for charts is often a challenge for traders, and this one is no exception. Varying zoom factors on your chart and the frequency of profile resets will require different profile formats. You can achieve a reasonable variety of effects by playing with the following input fields:
• "Resets on" controls how frequently new profiles are drawn. Spacing out profiles between bars can help make them more usable.
• "Levels" determines the maximum quantity of levels displayed.
• "Offset" allows you to shift the profile horizontally.
• "Profile size" affects the global size of the profile.
• Another "Size" field provides control over the size of the totals displayed above the profile.
• "Maximum line length" controls how far away from the center of the bar the lines will stretch left and right.
Colors
The color and brightness of levels and totals always allows you to determine the winning side between up and down values. On double-sided profiles, each side is always of one color, since the left side is down values and the right side, up values. However, the losing side is colored with half its brightness, so the emphasis is put on the winning side. When there is no winner, the toned-down version of each color is used for both sides. Single-sided profiles use the up and down colors in full brightness on the same side. Which one is used reflects the winning side.
Candles
The indicator can color candle bodies and borders independently. If you choose to do so, you may want to disable the chart's bars by using the eye icon near the symbol's name.
Tooltips
A tooltip showing the value of each level is available. If they do not appear when hovering over levels, select the indicator by clicking on its chart name. This should get the tooltips working.
Data Window
As usual, I provide key values in the Data Window, so you can track them. If you compare total realtime volumes for the profile and the built-in "Volume" indicator, you may see variations at some points. They are due to the different mechanisms running each program. In my experience, the values from the built-in don't always update as often as those of the profile, but they eventually catch up.
█ LIMITATIONS
• The levels do not appear exactly at the position they are calculated. They are positioned slightly lower than their actual price levels.
• Drawing a 20-level double-sided profile with totals requires 42 labels. The script will only display the last 500 labels,
so the number of levels you choose affects how many past profiles will remain visible.
• The script is quite taxing, which will sometimes make the chart's tab less responsive.
• When you first load the indicator on a chart, it will begin calculating from that moment; it will not take into account prior chart activity.
• If you let the script run long enough when using profile reset criteria that make profiles last for a long time, the script will eventually run out of memory,
as it will be tracking unmanageable amounts of chart updates. I don't know the exact quantity of updates that will cause this,
but the script can handle upwards of 60K updates per profile, which should last 1D except on the most active markets. You can follow the number of updates in the Data Window.
• The indicator's nature makes it more useful at very small timeframes, typically in the sub 15min realm.
• The Weis Wave trend detection used here has nothing to do with how David Weis detects trend changes.
LazyBear's version was a port of a port, so we are a few generations removed from the Weis technique, which uses reversals by a price unit.
I believe the version used here is useful nonetheless because it complements Supertrend rather well.
█ NOTES
The aggregated view that volume and tick profiles calculate for traders is a good example of one of the most useful things software can do for traders: look at things from a methodical, mathematical perspective, and present results in a meaningful way. Profiles are powerful because, if the volume data they use is of good enough quality, they tell us what levels are important for traders, regardless of the nature or rationality of the methods traders have used to determine those levels. Profiles don't care whether traders use the news, fundamentals, Fib numbers, pivots, or the phases of the moon to find "their" levels. They don't attempt to forecast or explain markets. They show us real stuff containing zero uncertainty, i.e., what HAS happened. I like this.
The indicator's "VPAA" chart name represents four of the five dimensions the indicator displays: volume, price, activity and age. The time dimension is implied by the fact it's a profile — and I couldn't find a proper place for a "T" in there )
I have not included alerts in the script. I may do so in the future.
For the moment, I have no plans to write a profile indicator that works on historical bars. TradingView's volume profiles already do that, and they run much faster than Pine versions could, so I don't see the point in spending efforts on a poor ersatz.
For Pine Coders
• The script uses labels that draw varying quantities of characters to break the limitation constraining other Pine plots/lines to bar boundaries.
• The code's structure was optimized for performance. When it was feasible, global arrays, "input" and other variables were used from functions,
sacrificing function readability and portability for speed. Code was also repeated in some places, to avoid the overhead of frequent function calls in high-traffic areas.
• I wrote my script using the revised recommendations in the Style Guide from the Pine v5 User Manual.
█ THANKS
• To Duyck for his function that sorts an array while keeping it in synch with another array.
The `sortTwoArrays()` function in my script is derived from the Pine Wizard 's code.
• To the one and only Maestro, RicardoSantos , the creative volcano who worked hard to write a function to produce fixed-width, figure space-padded numeric values.
A change in design made the function unnecessary in this script, but I am grateful to you nonetheless.
• To midtownskr8guy , another Pine Wizard who is also a wizard with colors. I use the colors from his Pine Color Magic and Chart Theme Simulator constantly.
• Finally, thanks to users of my earlier "Delta Volume" scripts. Comments and discussions with them encouraged me to persist in figuring out how to achieve what this indicator does.

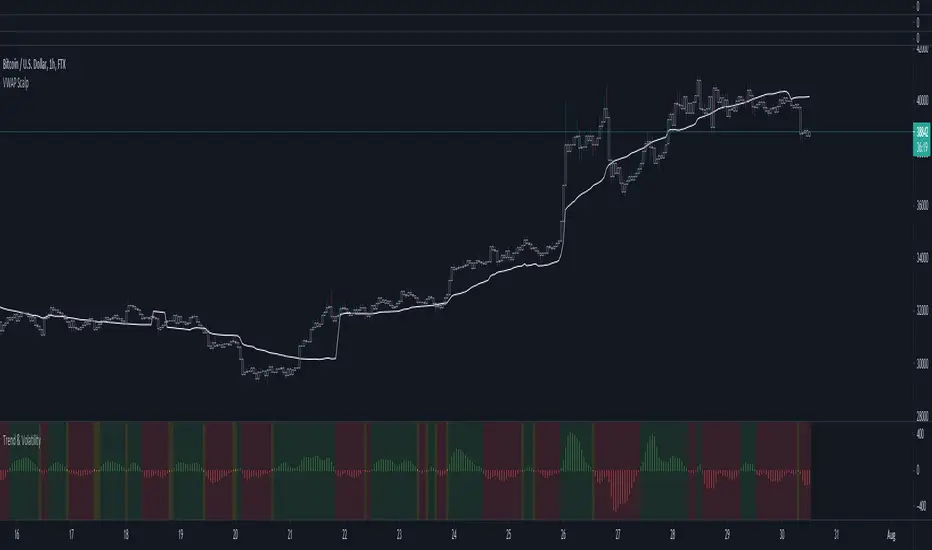
Market Trend using First Derivative of MAs + Volatility Based on Smooth First Derivative Indicator by tbiktag
Volatility also from another public TV script, forgot which one though, sorry if this is yours and I haven't credited your work, let me know if it is and I'll reference it properly.
About this indicator:
Estimates whether market is trending up, down or sideways by adding the slope (first derivatives) of a fast & slow MA. Uptrend = Green, Downtrend = Red, Sideways = Yellow
Uses a minimum slope percentile to determine threshold for uptrend, downtrend & sideways. Definitely adjust this when changing timeframes, for BTCUSD at 1 hour timeframe a value of 25 is decent
Also has a measure of Volatility if you're into that
Explanation of inputs:
Bandwidth - for derivative function
Fastma - period for fast Moving Average
Slowma - period for slow Moving Average
Derivmalength - smooths out the signal, reducing single contrasting bars, but delays the signal. Use 1 if don't want to use
V length - ema of volatility if you want to smooth it
Min Slope Percentile - slope should exceed this percentile to be classified as uptrend (green) or downtrend (red) anything in this bottom percentile will be considered sideways
Mine Slope Lookback Period - # of bars back to calculate Slope Percentile
Renko chartThis script displays the renko chart of the candlesticks chart
The color of the chart is green (red) if the trend is up (down).
The following settings are available:
Renko parameters:
Style = Box Size Assignment Method: 'ATR', 'Traditional'.
Parameter = ATR Length if `Style` is equal to 'ATR', or Box Size if `style` is equal to 'Traditional'.
Timeframe parameters:
Period = Resolution, e.g. 'm' - minutes, 'D' - daily, 'W' - weekly, 'M' - monthly, or same as chart
Multiplier = Multiplier of resolution, e.g. '60' - 60m if Period is 'm'
Alerts are also provided, to catch these conditions:
trend change = up to down or viceversa
bullish reversal = down to up
bearish reversal = up to down

Using `varip` variables [PineCoders]█ OVERVIEW
The new varip keyword in Pine can be used to declare variables that escape the rollback process, which is explained in the Pine User Manual's page on the execution model . This publication explains how Pine coders can use variables declared with varip to implement logic that was impossible to code in Pine before, such as timing events during the realtime bar, or keeping track of sequences of events that occur during successive realtime updates. We present code that allows you to calculate for how much time a given condition is true during a realtime bar, and show how this can be used to generate alerts.
█ WARNINGS
1. varip is an advanced feature which should only be used by coders already familiar with Pine's execution model and bar states .
2. Because varip only affects the behavior of your code in the realtime bar, it follows that backtest results on strategies built using logic based on varip will be meaningless,
as varip behavior cannot be simulated on historical bars. This also entails that plots on historical bars will not be able to reproduce the script's behavior in realtime.
3. Authors publishing scripts that behave differently in realtime and on historical bars should imperatively explain this to traders.
█ CONCEPTS
Escaping the rollback process
Whereas scripts only execute once at the close of historical bars, when a script is running in realtime, it executes every time the chart's feed detects a price or volume update. At every realtime update, Pine's runtime normally resets the values of a script's variables to their last committed value, i.e., the value they held when the previous bar closed. This is generally handy, as each realtime script execution starts from a known state, which simplifies script logic.
Sometimes, however, script logic requires code to be able to save states between different executions in the realtime bar. Declaring variables with varip now makes that possible. The "ip" in varip stands for "intrabar persist".
Let's look at the following code, which does not use varip :
//@version=4
study("")
int updateNo = na
if barstate.isnew
updateNo := 1
else
updateNo := updateNo + 1
plot(updateNo, style = plot.style_circles)
On historical bars, barstate.isnew is always true, so the plot shows a value of "1". On realtime bars, barstate.isnew is only true when the script first executes on the bar's opening. The plot will then briefly display "1" until subsequent executions occur. On the next executions during the realtime bar, the second branch of the if statement is executed because barstate.isnew is no longer true. Since `updateNo` is initialized to `na` at each execution, the `updateNo + 1` expression yields `na`, so nothing is plotted on further realtime executions of the script.
If we now use varip to declare the `updateNo` variable, the script behaves very differently:
//@version=4
study("")
varip int updateNo = na
if barstate.isnew
updateNo := 1
else
updateNo := updateNo + 1
plot(updateNo, style = plot.style_circles)
The difference now is that `updateNo` tracks the number of realtime updates that occur on each realtime bar. This can happen because the varip declaration allows the value of `updateNo` to be preserved between realtime updates; it is no longer rolled back at each realtime execution of the script. The test on barstate.isnew allows us to reset the update count when a new realtime bar comes in.
█ OUR SCRIPT
Let's move on to our script. It has three parts:
— Part 1 demonstrates how to generate alerts on timed conditions.
— Part 2 calculates the average of realtime update prices using a varip array.
— Part 3 presents a function to calculate the up/down/neutral volume by looking at price and volume variations between realtime bar updates.
Something we could not do in Pine before varip was to time the duration for which a condition is continuously true in the realtime bar. This was not possible because we could not save the beginning time of the first occurrence of the true condition.
One use case for this is a strategy where the system modeler wants to exit before the end of the realtime bar, but only if the exit condition occurs for a specific amount of time. One can thus design a strategy running on a 1H timeframe but able to exit if the exit condition persists for 15 minutes, for example. REMINDER: Using such logic in strategies will make backtesting their complete logic impossible, and backtest results useless, as historical behavior will not match the strategy's behavior in realtime, just as using `calc_on_every_tick = true` will do. Using `calc_on_every_tick = true` is necessary, by the way, when using varip in a strategy, as you want the strategy to run like a study in realtime, i.e., executing on each price or volume update.
Our script presents an `f_secondsSince(_cond, _resetCond)` function to calculate the time for which a condition is continuously true during, or even across multiple realtime bars. It only works in realtime. The abundant comments in the script hopefully provide enough information to understand the details of what it's doing. If you have questions, feel free to ask in the Comments section.
Features
The script's inputs allow you to:
• Specify the number of seconds the tested conditions must last before an alert is triggered (the default is 20 seconds).
• Determine if you want the duration to reset on new realtime bars.
• Require the direction of alerts (up or down) to alternate, which minimizes the number of alerts the script generates.
The inputs showcase the new `tooltip` parameter, which allows additional information to be displayed for each input by hovering over the "i" icon next to it.
The script only displays useful information on realtime bars. This information includes:
• The MA against which the current price is compared to determine the bull or bear conditions.
• A dash which prints on the chart when the bull or bear condition is true.
• An up or down triangle that prints when an alert is generated. The triangle will only appear on the update where the alert is triggered,
and unless that happens to be on the last execution of the realtime bar, it will not persist on the chart.
• The log of all triggered alerts to the right of the realtime bar.
• A gray square on top of the elapsed realtime bars where one or more alerts were generated. The square's tooltip displays the alert log for that bar.
• A yellow dot corresponding to the average price of all realtime bar updates, which is calculated using a varip array in "Part 2" of the script.
• Various key values in the Data Window for each parts of the script.
Note that the directional volume information calculated in Part 3 of the script is not plotted on the chart—only in the Data Window.
Using the script
You can try running the script on an open market with a 30sec timeframe. Because the default settings reset the duration on new realtime bars and require a 20 second delay, a reasonable amount of alerts will trigger.
Creating an alert on the script
You can create a script alert on the script. Keep in mind that when you create an alert from this script, the duration calculated by the instance of the script running the alert will not necessarily match that of the instance running on your chart, as both started their calculations at different times. Note that we use alert.freq_all in our alert() calls, so that alerts will trigger on all instances where the associated condition is met. If your alert is being paused because it reaches the maximum of 15 triggers in 3 minutes, you can configure the script's inputs so that up/down alerts must alternate. Also keep in mind that alerts run a distinct instance of your script on different servers, so discrepancies between the behavior of scripts running on charts and alerts can occur, especially if they trigger very often.
Challenges
Events detected in realtime using variables declared with varip can be transient and not leave visible traces at the close of the realtime bar, as is the case with our script, which can trigger multiple alerts during the same realtime bar, when the script's inputs allow for this. In such cases, elapsed realtime bars will be of no use in detecting past realtime bar events unless dedicated code is used to save traces of events, as we do with our alert log in this script, which we display as a tooltip on elapsed realtime bars.
█ NOTES
Realtime updates
We have no control over when realtime updates occur. A realtime bar can open, and then no realtime updates can occur until the open of the next realtime bar. The time between updates can vary considerably.
Past values
There is no mechanism to refer to past values of a varip variable across realtime executions in the same bar. Using the history-referencing operator will, as usual, return the variable's committed value on previous bars. If you want to preserve past values of a varip variable, they must be saved in other variables or in an array .
Resetting variables
Because varip variables not only preserve their values across realtime updates, but also across bars, you will typically need to plan conditions that will at some point reset their values to a known state. Testing on barstate.isnew , as we do, is a good way to achieve that.
Repainting
The fact that a script uses varip does not make it necessarily repainting. A script could conceivably use varip to calculate values saved when the realtime bar closes, and then use confirmed values of those calculations from the previous bar to trigger alerts or display plots, avoiding repaint.
timenow resolution
Although the variable is expressed in milliseconds it has an actual resolution of seconds, so it only increments in multiples of 1000 milliseconds.
Warn script users
When using varip to implement logic that cannot be replicated on historical bars, it's really important to explain this to traders in published script descriptions, even if you publish open-source. Remember that most TradingViewers do not know Pine.
New Pine features used in this script
This script uses three new Pine features:
• varip
• The `tooltip` parameter in input() .
• The new += assignment operator. See these also: -= , *= , /= and %= .
Example scripts
These are other scripts by PineCoders that use varip :
• Tick Delta Volume , by RicadoSantos .
• Tick Chart and Volume Info from Lower Time Frames by LonesomeTheBlue .
Thanks
Thanks to the PineCoders who helped improve this publication—especially to bmistiaen .
Look first. Then leap.

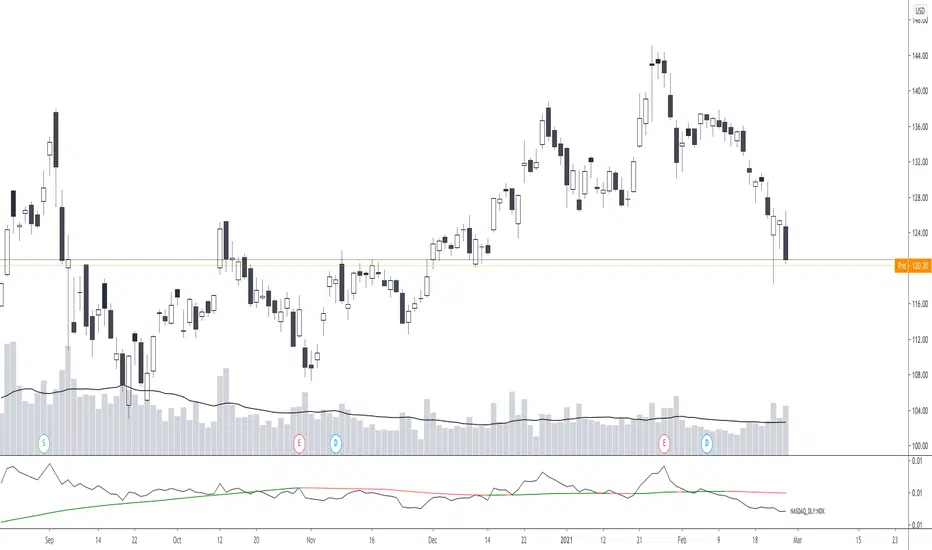
Relative Strength RatioAbout this indicator:
This indicator goes under many different names such as Relative Strength Ratio, Comparative Strength, Relative Strength Comparison (RSC) etc.
It compares the strength of the current asset to another asset of your choice and displays the relative strength of the current asset. (Not RSI)
There are several comparative indicators published already here on TV but I have added some unique features that I think is really useful.
When to use it:
This is useful when you want to compare for example a stock with its sector to find out if the stock is a leadership stock in that sector or main index.
You could also use it to compare the sector to its index etc.
If you want to compare for example a stock to both its index and its sector at the same time I suggest you add 2 instances of this indicator.
In many trading systems you are supposed find the strongest tickers by identifying "layers of strength" like 1. The strongest asset class that money is flowing into (like stocks, commodities, bonds, etc.) 2. Find the strongest sectors. 3. Find the stocks outperforming those sectors. 4. Find some kind of entry signal there.
How it works:
The indicator calculates an "RS line" (Relative Strength) by dividing the current ticker with a ticker of your choice. This creates a ratio or pair similar to how currencies are related to each others like USDGBP (dollar against pound). The RS line is black by default so you might want to change its color if you use a dark theme.
If the RS line is moving up it means your current asset is stronger than the asset you are comparing it with and vice versa.
Use the simple moving average to quickly see long term strength trends.
Features
RS line
Shows the relative strength of the current asset.
SMA
This Simple Moving Average has directional coloring; green when it is angled up and red when it is angled down. You can customise the period in the settings. If you don't want the color change just make both up/down color the same.
Relative market label
This displays the market you are currently comparing with as a label next to the last data point.
Because I tried stocks in 2 different countries I want to know which index I am comparing with and this label saves me from going into the settings to check. I find it to be a life saver!
Please let me know if you find any problems or if you have any ideas for improvement
Bitcoin Bulls and Bears by @dbtrBitcoin 🔥 Bulls & Bears 🔥
v1.0
This free-of-charge BTC market analysis indicator helps you better understand what's going with Bitcoin from a high-level perspective. At a glance, it will give you an immediate understanding of Bitcoin’s historic price channel dating back to 2011, past and current market cycles, as well as current key support levels.
Usage
Use this indicator with any BTCUSD pairs , ideally with a long price history (such as BNC:BLX )
We recommend to use this indicator in log mode, combined with Weekly or Monthly timeframe.
Features
🕵🏻♂️ Historic price channel curve since 2011
🚨 Bull & bear market cycles (dynamic)
🔥 All-time highs (dynamic)
🌟 Weekly support (dynamic, based on 20 SMA )
💪 Long-term support (channel bottom)
🔝 Potential future price targets (dynamic)
❎ Overbought RSI coloring
📏 Log/non-log support
🌚 Dark mode support
Remarks
With exception of the price channel curve, anything in this indicator is calculated dynamically , including bull/bear market cycles (based on a tweaked 20SMA), ATHs, and so on. As a result, historic market cycles may not be 100% accurately reflected and may also differ slightly in between various time-frames (closest result: Monthly). The indicator may even consider periods of heavy ups/downs as their own market cycles, even though they weren’t. Due to its dynamic nature, this indicator can however adapt to the future and helps you quickly identify potential changes in market structure, even if the indicator is no longer updated.
On top of that bullmarket cycles (colored in green) feature an ingrained RSI: the darker the green color, the more the RSI is overbought and close to a correction (darkest color in the chart = 90 Weekly RSI). In comparison with past bull cycles, it helps you easily spot potential reversal zones.
Thanks
Thanks to @quantadelic and @mabonyi which both have worked on the BTC "growth zones" indicator including the price channel, of which I have used parts of the code as well as the actual price channel data.
Follow me
Follow me here on TradingView to be notified as soon as new free and premium indicators and trading strategies are published. Inquire me for any other requests.
Enjoy & happy trading!

Pattern Recognition Probabilities [racer8]Brief 🌟
Pattern Recognition Probabilities (PRP) is a REALLY smart indicator. It uses the correlation coefficient formula to determine if the current set of bars resembles that of past patterns. It counts the number of times the current pattern has occurred in the past and looks at how it performed historically to determine the probability of an up move, down move, or neutral move.
I'd like to say, I'm proud of this indicator 😆🤙 This is the SMARTEST indicator I have ever made 🧠🧠🧠
Note: PRP doesn't give you actual probabilities, but gives you instead the historical occurrences of up, down, and neutral moves that resulted after the pattern. So you can calculate probabilities based on these valuable statistics. So for example, PRP can tell you this pattern has historically resulted in 55 up moves, 20 down moves, and 60 neutral moves.
Parameters 🌟
You can adjust the Pattern length, Minimum correlation, Statistics lookback, Exit after time, and Atr multiplier parameters.
Pattern length - determines how long the pattern is
Minimum correlation - determines the minimum correlation coefficient needed to pass as a similiar enough pattern.
Statistics lookback - lookback period for gathering all the patterns in the past.
Exit after time - determines when exit occurred (number of periods after pattern) ; is the point that represents the pattern's result.
Atr multiplier - determines minimum atr move needed to qualify whether result was an up/down move or a neutral move. If a particular historical pattern resulted in a move that was less than the min atr, then it is recorded as a neutral move in the statistics.
Thanks for reading! 🙏
Good luck 🍀 Stay safe 😷 Drink lots of water💧
Enjoy! 🥳 and Hit the like button! 👍
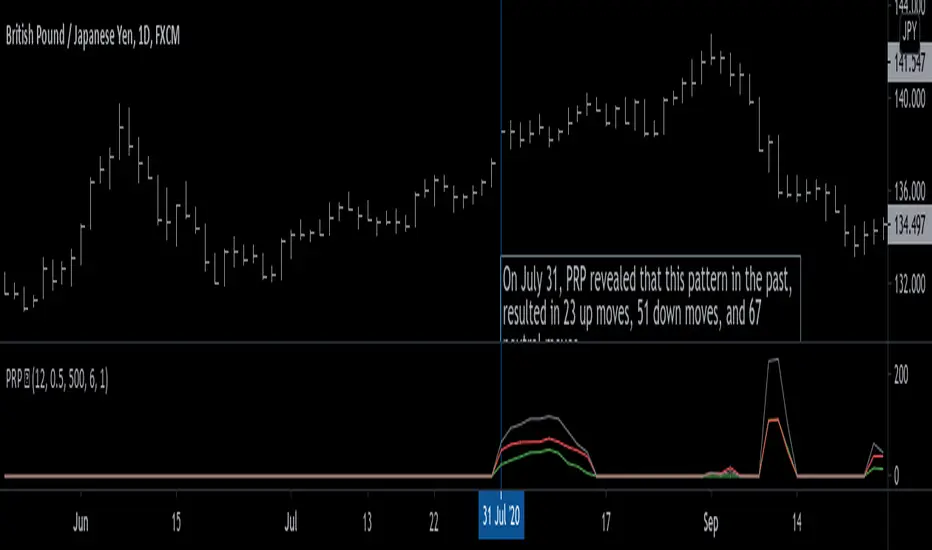
Relative Volume at Time█ OVERVIEW
This indicator calculates relative volume, which is the ratio of present volume over an average of past volume.
It offers two calculation modes, both using a time reference as an anchor.
█ CONCEPTS
Calculation modes
The simplest way to calculate relative volume is by using the ratio of a bar's volume over a simple moving average of the last n volume values.
This indicator uses one of two, more subtle ways to calculate both values of the relative volume ratio: current volume:past volume .
The two calculations modes are:
1 — Cumulate from Beginning of TF to Current Bar where:
current volume = the cumulative volume since the beginning of the timeframe unit, and
past volume = the mean of volume during that same relative period of time in the past n timeframe units.
2 — Point-to-Point Bars at Same Offset from Beginning of TF where:
current volume = the volume on a single chart bar, and
past volume = the mean of volume values from that same relative bar in time from the past n timeframe units.
Timeframe units
Timeframe units can be defined in three different ways:
1 — Using Auto-steps, where the timeframe unit automatically adjusts to the timeframe used on the chart:
— A 1 min timeframe unit will be used on 1sec charts,
— 1H will be used for charts at 1min and less,
— 1D will be used for other intraday chart timeframes,
— 1W will be used for 1D charts,
— 1M will be used for charts at less than 1M,
— 1Y will be used for charts at greater or equal than 1M.
2 — As a fixed timeframe that you define.
3 — By time of day (for intraday chart timeframes only), which you also define. If you use non-intraday chart timeframes in this mode, the indicator will switch to Auto-steps.
Relative Relativity
A relative volume value of 1.0 indicates that current volume is equal to the mean of past volume , but how can we determine what constitutes a high relative volume value?
The traditional way is to settle for an arbitrary threshold, with 2.0 often used to indicate that relative volume is worthy of attention.
We wanted to provide traders with a contextual method of calculating threshold values, so in addition to the conventional fixed threshold value,
this indicator includes two methods of calculating a threshold channel on past relative volume values:
1 — Using the standard deviation of relative volume over a fixed lookback.
2 — Using the highs/lows of relative volume over a variable lookback.
Channels calculated on relative volume provide meta-relativity, if you will, as they are relative values of relative volume.
█ FEATURES
Controls in the "Display" section of inputs determine what is visible in the indicator's pane. The next "Settings" section is where you configure the parameters used in the calculations. The "Column Coloring Conditions" section controls the color of the columns, which you will see in three of the five display modes available. Whether columns are plotted or not, the coloring conditions also determine when markers appear, if you have chosen to show the markers in the "Display" section. The presence of markers is what triggers the alerts configured on this indicator. Finally, the "Colors" section of inputs allows you to control the color of the indicator's visual components.
Display
Five display modes are available:
• Current Volume Columns : shows columns of current volume , with past volume displayed as an outlined column.
• Relative Volume Columns : shows relative volume as a column.
• Relative Volume Columns With Average : shows relative volume as a column, with the average of relative volume.
• Directional Relative Volume Average : shows a line calculated using the average of +/- values of relative volume.
The positive value of relative volume is used on up bars; its negative value on down bars.
• Relative Volume Average : shows the average of relative volume.
A Hull moving average is used to calculate the average used in the three last display modes.
You can also control the display of:
• The value or relative volume, when in the first three display modes. Only the last 500 values will be shown.
• Timeframe transitions, shown in the background.
• A reminder of the active timeframe unit, which appears to the right of the indicator's last bar.
• The threshold used, which can be a fixed value or a channel, as determined in the next "Settings" section of inputs.
• Up/Down markers, which appear on transitions of the color of the volume columns (determined by coloring conditions), which in turn control when alerts are triggered.
• Conditions of high volatility.
Settings
Use this section of inputs to change:
• Calculation mode : this is where you select one of this indicator's two calculation modes for current volume and past volume , as explained in the "Concepts" section.
• Past Volume Lookback in TF units : the quantity of timeframe units used in the calculation of past volume .
• Define Timeframes Units Using : the mode used to determine what one timeframe unit is. Note that when using a fixed timeframe, it must be higher than the chart's timeframe.
Also, note that time of day timeframe units only work on intraday chart timeframes.
• Threshold Mode : Five different modes can be selected:
— Fixed Value : You can define the value using the "Fixed Threshold" field below. The default value is 2.0.
— Standard Deviation Channel From Fixed Lookback : This is a channel calculated using the simple moving average of relative volume
(so not the Hull moving average used elsewhere in the indicator), plus/minus the standard deviation multiplied by a user-defined factor.
The lookback used is the value of the "Channel Lookback" field. Its default is 100.
— High/Low Channel From Beginning of TF : in this mode, the High/Low values reset at the beginning of each timeframe unit.
— High/Low Channel From Beginning of Past Volume Lookback : in this mode, the High/Low values start from the farthest point back where we are calculating past volume ,
which is determined by the combination of timeframe units and the "Past Volume Lookback in TF units" value.
— High/Low Channel From Fixed Lookback : In this mode the lookback is fixed. You can define the value using the "Channel Lookback" field. The default value is 100.
• Period of RelVol Moving Average : the period of the Hull moving average used in the "Directional Relative Volume Average" and the "Relative Volume Average".
• High Volatility is defined using fast and slow ATR periods, so this represents the volatility of price.
Volatility is considered to be high when the fast ATR value is greater than its slow value. Volatility can be used as a filter in the column coloring conditions.
Column Coloring Conditions
• Eight different conditions can be turned on or off to determine the color of the volume columns. All "ON" conditions must be met to determine a high/low state of relative volume,
or, in the case of directional relative volume, a bull/bear state.
• A volatility state can also be used to filter the conditions.
• When the coloring conditions and the filter do not allow for a high/low state to be determined, the neutral color is used.
• Transitions of the color of the volume columns determined by coloring conditions are used to plot the up/down markers, which in turn control when alerts are triggered.
Colors
• You can define your own colors for all of the oscillator's plots.
• The default colors will perform well on light or dark chart backgrounds.
Alerts
• An alert can be defined for the script. The alert will trigger whenever an up/down marker appears in the indicator's display.
The particular combination of coloring conditions and the display settings for up/down markers when you create the alert will determine which conditions trigger the alert.
After alerts are created, subsequent changes to the conditions controlling the display of markers will not affect existing alerts.
• By configuring the script's inputs in different ways before you create your alerts, you can create multiple, functionally distinct alerts from this script.
When creating multiple alerts, it is useful to include in the alert's message a reminder of the particular conditions you used for each alert.
• As is usually the case, alerts triggering "Once Per Bar Close" will prevent repainting.
Error messages
Error messages will appear at the end of the chart upon the following conditions:
• When the combination of the timeframe units used and the "Past Volume Lookback in TF units" value create a lookback that is greater than 5000 bars.
The lookback will then be recalculated to a value such that a runtime error does not occur.
• If the chart's timeframe is higher than the timeframe units. This error cannot occur when using Auto-steps to calculate timeframe units.
• If relative volume cannot be calculated, for example, when no volume data is available for the chart's symbol.
• When the threshold of relative volume is configured to be visible but the indicator's scale does not allow it to be visible (in "Current Volume Columns" display mode).
█ NOTES
For traders
The chart shown here uses the following display modes: "Current Volume Columns", "Relative Volume Columns With Average", "Directional Relative Volume Average" and "Relative Volume Average". The last one also shows the threshold channel in standard deviation mode, and the TF Unit reminder to the right, in red.
Volume, like price, is a value with a market-dependent scale. The only valid reference for volume being its past values, any improvement in the way past volume is calculated thus represents a potential opportunity to traders. Relative volume calculated as it is here can help traders extract useful information from markets in many circumstances, markets with cyclical volume such as Forex being one, obvious case. The relative nature of the values calculated by this indicator also make it a natural fit for cross-market and cross-sector analysis, or to identify behavioral changes in the different futures contracts of the same market. Relative volume can also be put to more exotic uses, such as in evaluating changes in the popularity of exchanges.
Relative volume alone has no directional bias. While higher relative volume values always indicate higher trading activity, that activity does not necessarily translate into significant price movement. In a tightly fought battle between buyers and sellers, you could theoretically have very large volume for many bars, with no change whatsoever in bid/ask prices. This of course, is unlikely to happen in reality, and so traders are justified in considering high relative volume values as indicating periods where more attention is required, because imbalances in the strength of buying/selling power during high-volume trading periods can amplify price variations, providing traders with the generally useful gift of volatility.
Be sure to give the "Directional Relative Volume Average" a try. Contrary to the always-positive ratio widely used in this indicator, the "Directional Relative Volume Average" produces a value able to determine a bullish/bearish bias for relative volume.
Note that realtime bars must be complete for the relative volume value to be confirmed. Values calculated on historical or elapsed realtime bars will not recalculate unless historical volume data changes.
Finally, as with all indicators using volume information, keep in mind that some exchanges/brokers supply different feeds for intraday and daily data, and the volume data on both feeds can sometimes vary quite a bit.
For coders
Our script was written using the PineCoders Coding Conventions for Pine .
The description was formatted using the techniques explained in the How We Write and Format Script Descriptions PineCoders publication.
Bits and pieces of code were lifted from the MTF Selection Framework and the MTF Oscillator Framework , also by PineCoders.
█ THANKS
Thanks to dgtrd for suggesting to add the channel using standard deviation.
Thanks to adolgov for helpful suggestions on calculations and visuals.
Look first. Then leap.

Linear Regression ChannelHello Traders,
There are several nice Linear Regression Channel scripts in the Public Library. and I tried to make one with some extra features too. This one can check if the Price breaks the channel and it shows where is was broken. Also it checks the momentum of the channel and shows it's increasing/decreasing/equal in a label, shape of the label also changes. The line colors change according to direction.
using the options, you can;
- Set the Source (Close, HL2 etc)
- Set the Channel length
- Set Deviation
- Change Up/Down Line colors
- Show/hide broken channels
- Change line width
meaning of arrows:
⇑ : Uptrend and moment incresing
⇗ : Uptrend and moment decreasing
⇓ : Downtrend and moment incresing
⇘ : Downtrend and moment decreasing
⇒ : No trend
An example for how color of lines, arrow direction and shape of label change.
Enjoy!

[ProfitTrailer:Feeder] Up Down VolatilityUpside & DownSide Volatility is commonly used in the ProfitTrailer:Feeder community scene, so I decided to create a script for it.
Please 'follow & like' if you like this script! Thanks

Bull vs Bear Power by DGTElder-Ray Bear and Bull Power
Dr. Alexander Elder cleverly named his first indicator Elder-Ray because of its function, which is designed to see through the market like an X-ray machine. Developed in 1989, the Elder-Ray indicator can be applied to the chart of any security and helps traders determine the strength of competing groups of bulls and bears by gazing under the surface of the markets for data that may not immediately be ascertainable from a superficial glance at prices
The Elder-Ray indicator is comprised by three elements – Bear Power, Bull Power and a 13-period Exponential Moving Average.
As the high price of any candle shows the maximum power of buyers and the low price of any candle shows the maximum power of sellers, Elder uses the 13-period EMA in order to present the average consensus of price value. Bull power shows whether buyers are capable of pushing prices above the average consensus of value. Bear power shows whether sellers are capable of pushing prices below the average consensus of value. Mathematically, Bull power is the result of subtracting the 13-period EMA from the high price of the day, and Bear power is the result of subtracting the 13-period EMA from the low price of the day.
What does this study implements
Attempts to customize interpretation of Alexander Elder's Elder-Ray Indicator (Bull and Bear Power) by
• adding additional insights to support/confirm Elder’s strategy with different indicators related with the Elder’s concept
• providing different options of visualization of the indicator
• providing smoothing capability
Other Indicators to support/confirm Elder-Ray Indicator:
Colored Directional Movement Index (CDMI) , a custom interpretation of J. Welles Wilder’s Directional Movement Index (DMI) , where :
DMI is a collection of three separate indicators ( ADX , +DI , -DI ) combined into one and measures the trend’s strength as well as its direction
CDMI is a custom interpretation of DMI which presents ( ADX , +DI , -DI ) with a color scale - representing the trend’s strength, color density - representing momentum/slope of the trend’s strength, and triangle up/down shapes - representing the trend’s direction. CDMI provides all the information in a single line with colored triangle shapes plotted on the top. DMI can provide quality information and even trading signals but it is not an easy indicator to master, whereus CDMI simplifies its usage.
Alexander Elder considers the slope of the EMA, which gives insight into the recent trend whether is up or down, and CDMI adds additional insight of verifying/confirming the trend as well as its strength
Note : educational content of how to read CDMI can be found in ideas section named as “Colored Directional Movement Index”
different usages of CDMI can be observed with studies “Candlestick Patterns in Context by DGT", “Ichimoku Colored SuperTrend + Colored DMI by DGT”, “Colored Directional Movement and Bollinger Band's Cloud by DGT”, and “Technical Analyst by DGT”
Price Convergence/Divergence , if we pay attention to mathematical formulations of bull power, bear power and price convergence/divergence (also can be expressed as price distance to its ma) we would clearly observe that price convergence/divergence is in fact the result of how the market performed based on the fact that we assume 13-period EMA is consensus of price value. Then, we may assume that the price convergence/divergence crosses of bull power, or bear power, or sum of bull and bear power could be considered as potential trading signals
Additionally, price convergence/divergence visualizes the belief that prices high above the moving average or low below it are likely to be remedied in the future by a reverse price movement
Alternatively, Least Squares Moving Average of Price Convergence/Divergence (also known as Linear Regression Curve) can be plotted instead of Price Convergence/Divergence which can be considered as a smoothed version of Price Convergence/Divergence
Note : different usages of Price Convergence/Divergence can be observed with studies “Trading Psychology - Fear & Greed Index by DGT”, “Price Distance to its MA by DGT”, “P-MACD by DGT”, where “Price Distance to its MA by DGT” can also be considered as educational content which includes an article of a research carried on the topic
Options of Visualization
Bull and Bear Power plotted as two separate
• histograms
• lines
• bands
Sum of Bull and Bear Power plotted as single
• histogram
• line
• band
Others
Price Convergence/Divergence displayed as Line
CDMI is displayed as single colored line of triangle shapes, where triangle shapes displays direction of the trend (triangle up represents bull and triangle down represent bear), colors of CDMI displays the strength of the trend (green – strong bullish, red – strong bearish, gray – no trend, yellow – week trend)
In general with this study, color densities also have a meaning and aims to displays if the value of the indicator is falling or growing, darker colors displays more intense move comparing to light one
Note : band's upper and lower levels are calculated by using standard deviation build-in function with multiply factor of 0.236 Fibonacci’s ratio (just a number for our case, no any meaning)
Smoothing
No smoothing is applied by default but the capability is added in case Price Convergence/Divergence Line is assumed to be used as a signal line it will be worth smoothing the bear, bull or sum of bear and bull power indicators
Interpreting Elder-Ray Indicator, according to Dr. Alexander Elder
Bull Power should remain positive in normal circumstances, while Bear Power should remain negative in normal circumstances. In case the Bull Power indicator enters into negative territory, this implies that sellers have overcome buyers and control the market. In case the Bear Power indicator enters into positive territory, this indicates that buyers have overcome sellers and control the market. A trader should not go long at times when the Bear Power indicator is positive and he/she should not go short at times when the Bull Power indicator is negative.
13-period EMAs slope can be used in order to identify the direction of the major trend. According to Elder, the most reliable buy signals are generated, when there is a bullish divergence between the Bear Power indicator and the price (Bear Power forms higher lows, while the market forms lower lows). The most reliable sell signals are generated, when there is a bearish divergence between the Bull Power indicator and the price (Bull Power forms lower highs, while the market forms higher highs).
There are four basic conditions, required to go long or short, with the use of the Elder-Ray method alone.
In order to go long:
1. The market is in a bull trend, as indicated by the 13-period EMA
2. Bear Power is in negative territory, but increasing
3. The most recent Bull Power top is higher than its prior top
4. Bear Power is going up from a bullish divergence
The last two conditions are optional that fine-tune the buying decision
In order to go short:
1. The market is in a bear trend, as indicated by the 13-period EMA
2. Bull Power is in positive territory, but falling
3. The most recent Bear Power bottom is lower than its prior bottom
4. Bull Power is falling from a bearish divergence
The last two conditions are optional, they provide a stronger signal for shorting but they are not absolutely essential
If a trader is willing to add to his/her position, he/she needs to:
1. add to his/her long position, when the Bear Power falls below zero and then climbs back into positive territory
2. add to his/her short position, when the Bull Power increases above zero and then drops back into negative territory.
note : terminology of the definitions used herein are as per TV dictionary
Trading success is all about following your trading strategy and the indicators should fit within your trading strategy, and not to be traded upon solely
Disclaimer : The script is for informational and educational purposes only. Use of the script does not constitute professional and/or financial advice. You alone have the sole responsibility of evaluating the script output and risks associated with the use of the script. In exchange for using the script, you agree not to hold dgtrd TradingView user liable for any possible claim for damages arising from any decision you make based on use of the script

KINSKI Laguerre Filter WaveThe "Laguerre Filter Wave" Indicator usually shows market cycles and is a perfect fit for swing traders who trade with market fluctuations. Upward-trends are shown as green lines and optional bands. Downward trends are represented by the color red. Each of the 18 available lines can be adjusted to your own preferences via a gamma factor.
You also have the following display options:
- "Up/Down Movements: On/Off" - Shows ascending and descending of lines
- "Bands: On/Off" - Fills the space between the lines with colors to indicate up or down trends
- "Bands: Transparency" - sets the transparency of the fill color
- "MA Line: Size" - sets the width of the lines
- "MA Line: Transparency" - sets the transparency of the lines

20 and 200 SMA indicators with unnecessary additionsAs many of you know, world famous Oliver Velez uses the simple 20 and 200 simple moving averages on 2 min time frame with price actions above or below these key SMAs for day/scalp trading involving narrow state versus wide state trend or anti-trend methods. The 20 SMA line uses different colors to indicate whether it is going up or down.
Against Oliver's advice, I also unnecessarily added boll bands on the 200 SMA, two +/- percent lines off 200 SMA to measure how far away prices are from the 200 SMA. I also added 10 ema cross 20 SMA cross signal, MACD line up /down, RSI crossover RSI SMA for those are want to make things complicated or might find they helpful. You can turn off all these ideally to Keep It Simple.
Again trading success is 80% psychology and 20% a good trading system plus risk management. Good luck.
